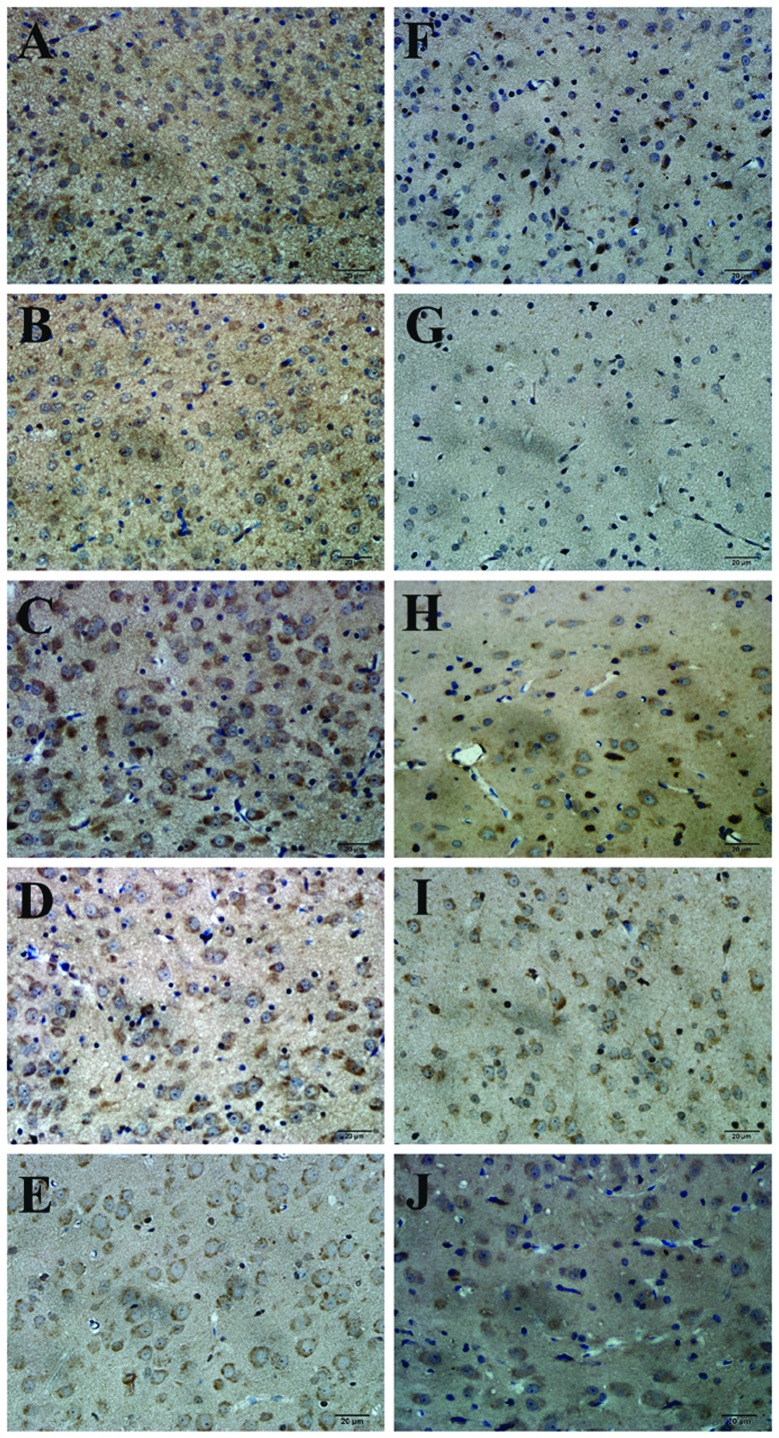
Figure 4.
OLIG1 protein expression in brain tissues, as measured by immunohistochemistry (magnification, ×500). At days 1, 3, 7, 14 and 21, the cytoplasm was stained brown (indicating that numerous cells were expressing the OLIG1 protein) in the brain tissues of the normoxia group (A–E). In the hypoxia-ischemia group, only a sparse distribution of cells expressing OLIG1 was observed, with numerous nuclei stained brown at day 1 (F). At day 3 (G), there were substantially fewer positively-stained cells, and at days 7, 14 and 21 (H–J) the positively-stained cells were more extensively distributed, although there remained a high number of yellow-stained nuclei.

