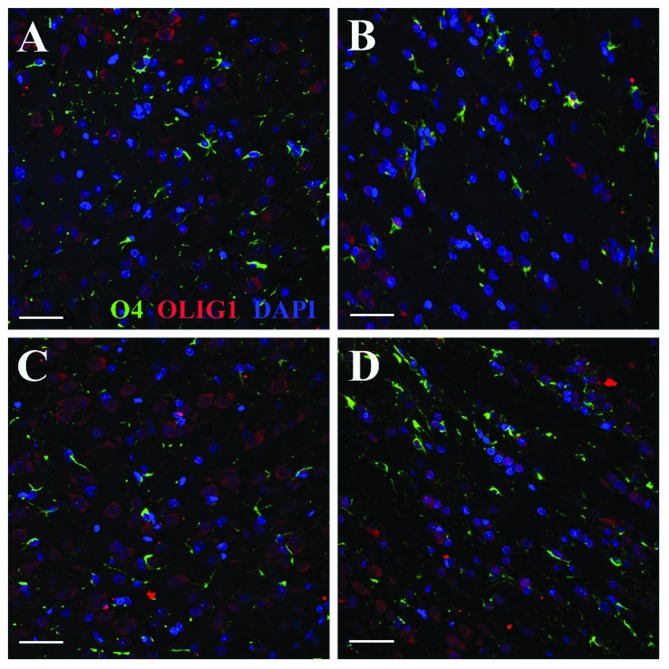
Figure 5.
Changes in the cellular localization of OLIG1 in brain tissues following hypoxia-ischemia (HI) (magnification, ×600). (A) Co-expression of O4 and OLIG1 in the cytoplasm without any sign of nuclear translocation was observed in the normoxia group. (B) The expression levels of OLIG1 were reduced compared with those in the normoxia group, and the OLIG1 staining observed was nuclear rather than cytoplasmic in the HI group. (C) At day 21 in the normoxia group, co-expression of O4 and OLIG1 in the cytoplasm was observed. (D) There was reduced expression of OLIG1 in the cell nuclei at day 21 in the HI group compared with the normoxia group, however the expression increased in the cell nuclei following (D) HI at day 21 compared with (C) day 7. Despite the late increase at day 21 in the HI group compared with day 7, the OLIG1 expression levels were still lower compared with those of the normoxia group.

