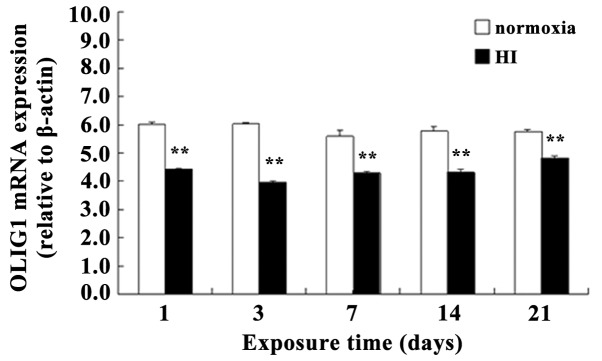
Figure 7.

Effects of hypoxia-ischemia (HI) on the OLIG1 mRNA level in brain tissues. Reverse transcription-quantitative polymerase chain reaction (RT-qPCR) results show no significant difference in the expression level of OLIG1 in the normoxia group at any time-point (P>0.05), while a marked decrease in the HI group is observed (P<0.01). In the HI group, the expression level of OLIG1 is the lowest at day 3 and increases at day 21 (P<0.01), but no significant differences are observed among days 3, 14 and 21 (P>0.01). The expression level of OLIG1 at day 21 is significantly lower than that in the normoxia group (P<0.01). Means ± standard deviation values are shown. **P<0.01 vs. normoxia group. All experiments were performed independently 4 times.
