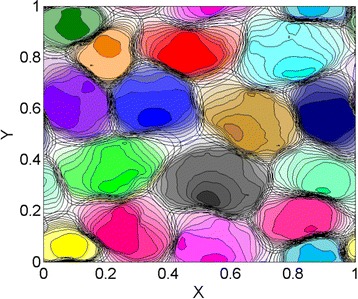
Figure 2.

Utilization distribution from a run of the territorial random walk model with 16 individuals (in a periodic lattice of 25 ×25 sites), a spatial competition strength of Z =32, and with the parameter α that controls the retreat response upon the encounter of foreign marks being 10 [53]. The emerging home ranges have been reconstructed over a time span equal to 2.5 times the decay time of the marks. The contour level values of the utilization distribution from the outer most to the inner most, when all present, are 10 −4 multiplied, respectively, by the following factors: 1, 2, 4, 6, 8, 10, 12, 14, 20, 40, and 80. Simulation code to generate this figure are freely available at doi:10.5061/dryad.v60r7.
