
Figure 5.
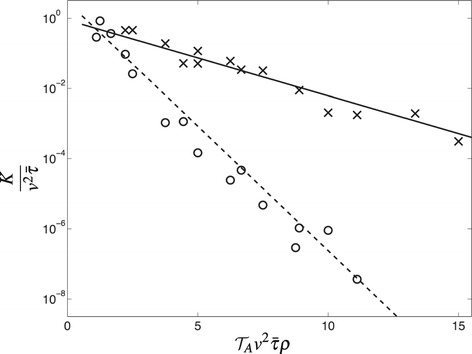
Relation between territory border diffusion constant K and the dimensionless quantity . For the diffusive case, the latter is proportional to the competition parameter Z described earlier in Section “Mutual interactions leading to territoriality: the effects of time scale disparity”. The data points are the simulation output of the territorial random walk model with full exclusion in the diffusive limit (crosses) and in the ballistic limit (circles). The solid line represents a best fit for diffusing animals, whereas the dashed line is the best fit for animals moving ballistically. Reproduced with permission from [188].