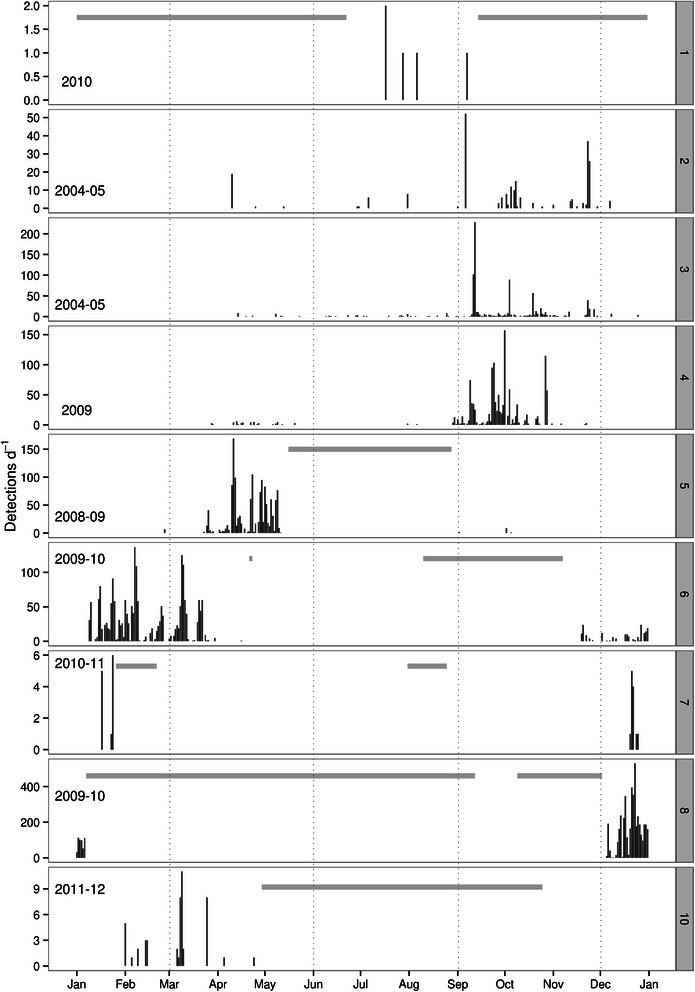
Figure 4.

Minke whale pulse train detections per day for all sites with more than 5 detections. Data are presented for one fictional, continuous year to show seasonality by site. True recording years are indicated in lower left corner on each panel. Missing data indicated by grey horizontal bars. Panel numbers correspond to numbered sites in overview map (see Figure 2). Note the different y-axes scales for each panel.
