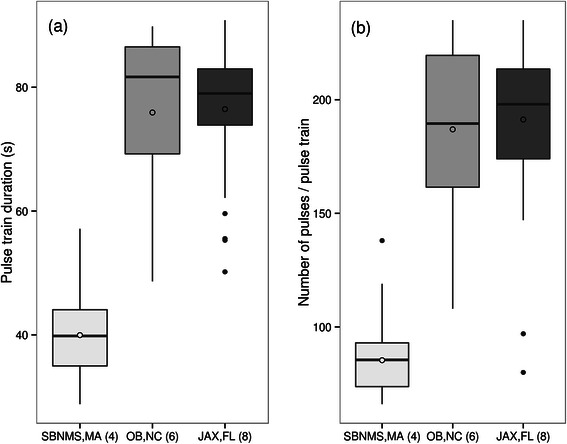
Figure 6.

Box-and-Whisker plot of (a) pulse train duration (s) and (b) number of pulses per pulse train at three different geographic locations: Stellwagen Bank (site 4), Onslow Bay (site 6), Jacksonville 2 (site 8) (see Figure 2 . for overview map). Lower and upper bounds of boxes represent lower and upper quartiles, respectively. Solid lines represent medians and non-filled circles are means. Whiskers represent furthest data points within 1.5 × interquartile range (IQR). Filled dots are outliers.
