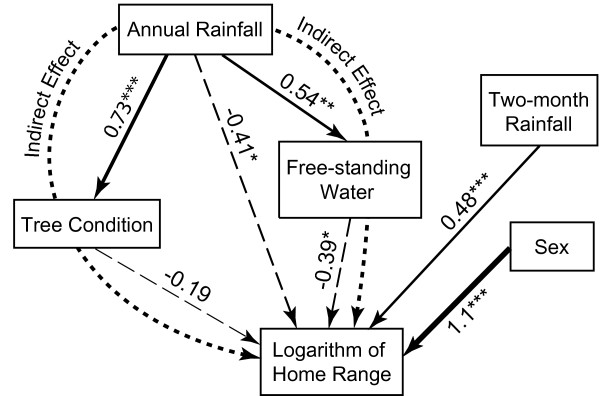
Figure 1.

Structural equation model diagram. The structural equation model diagram with the identified (by the solid and dashed arrows) direct dependences between the variables (shown in the boxes). The numbers next to the arrows show the corresponding regression coefficients between the respective variables in the boxes. The asterisks indicate the levels of significance for the respective regression coefficients: (*) p < 0.05; (**) p < 0.01; (***) p < 0.001; the absence of the asterisks means statistical insignificance. The direction and thickness of the arrows indicate the direction (causality) of the mutual impact of the variables and the approximate values of the regression coefficients, respectively. The dashed arrows indicate the negative regression coefficients. The dotted arrows show the indirect effects of annual rainfall on home range.
