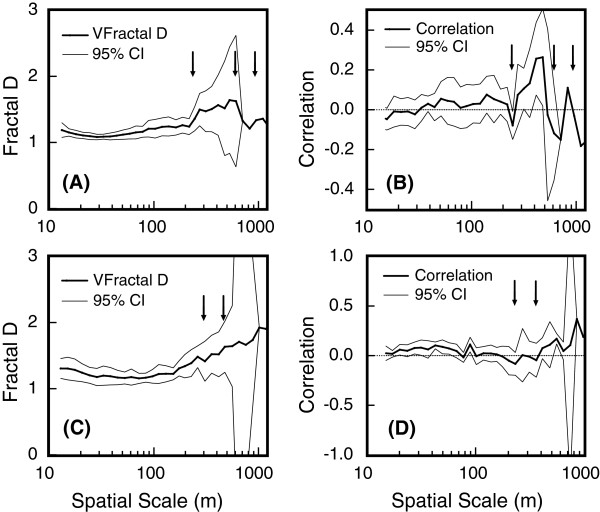
Figure 6.

Plots of fractal D and correlation in tortuosity of successive path segments of male and female koalas. (A) Mean fractal D, and (B) correlation in tortuosity of successive path segments with corresponding 95% confidence intervals for male koalas (n = 8) at varying spatial scales. (C) Mean fractal D, and (D) correlation in tortuosity of successive path segments with corresponding 95% confidence intervals for female koalas (n = 9) at varying spatial scales. Arrows represent point of inflection on plots of mean D ((A) and (C)). Dotted lines represent correlation = 0, and arrows represent drops in correlation below zero on plots of correlation in tortuosity of successive path segments ((B) and (D)). Movement patterns of male koalas showed three changes in movement patterns, at approximately 240, 610 and 950 m ((A) and (B)). Movement patterns of female koalas showed two changes in movement patterns, at approximately 230 – 260 m (similar to males) and the second at path lengths of 360 - 400 m ((C) and (D)).
