
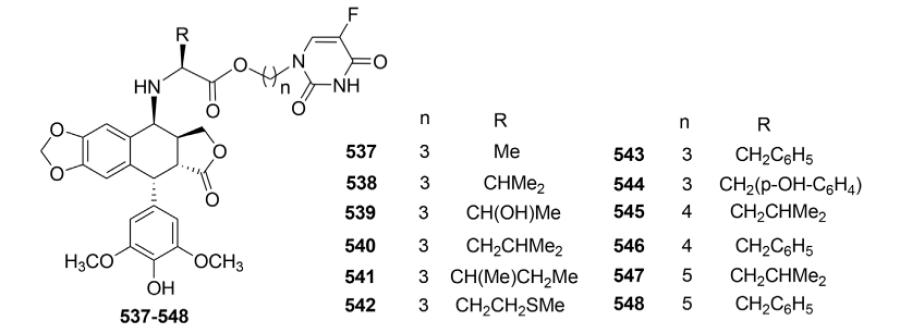
Table XIX.
Biological Data for 5-FU–DEPPT Conjugates 537–548
| |||||
|---|---|---|---|---|---|
| Cytotoxic activity (IC50, μM)a |
|||||
| Compound | K562b | AGSc | HL-60b | A-549c | log P |
| ETO | >100 | 50.8 | 2.75 | 7.38 | 0.69 |
| 5-FU | >100 | >100 | 65.3 | 50.5 | – |
| 537 | 19.5 | 40.4 | 22.3 | 2.59 | −0.07 |
| 538 | 13.5 | 62.5 | 5.80 | 1.92 | 0.34 |
| 539 | 30.8 | 140.8 | 23.2 | 6.95 | −0.12 |
| 540 | 9.5 | 59.2 | 0.13 | 0.01 | 0.33 |
| 541 | 5.1 | 56.2 | 0.24 | 0.18 | 0.59 |
| 542 | 8.8 | 24.8 | 0.99 | 0.29 | 0.23 |
| 543 | 5.8 | 23.6 | 0.31 | 0.48 | 0.65 |
| 544 | 28.6 | 114.7 | 26.6 | 21.7 | 0.07 |
| 545 | 5.3 | 34.5 | 0.73 | <0.01 | 0.35 |
| 546 | 9.2 | 23.7 | 0.42 | 0.30 | 0.43 |
| 547 | 6.0 | 23.5 | 0.31 | 0.53 | 0.51 |
| 548 | 13.2 | 38.8 | 0.04 | <0.01 | 0.29 |
a
Average of triplicate experiments.
b
The microculture [3-(4,5-dimethylthiazol-2-yl)-2,5-diphenyl tetrazolium bromide (MTT) assay method, 48 hr drug exposure.
c
the sulforhodamine B (SRB) colorimetric assay method, 72 hr drug exposure.