
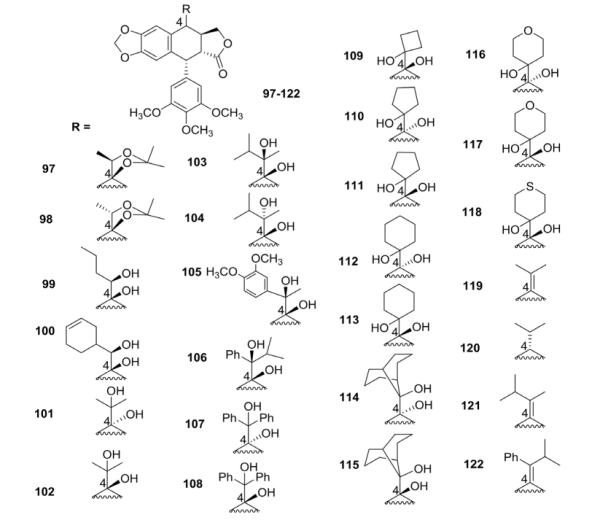
Table III.
Cytotoxicity Data for Pinacol, Alkylidene, and Alkyl Analogs 97–122
| |||
|---|---|---|---|
| GI50 ± SD (nM)a |
|||
| Compound | A-549 | HT-29 | SK-BR3 |
| EPPT | 60 | 60 | NT |
| 97 | 6220 ± 562 | 5230 ± 443 | 5870 ± 126 |
| 98 | 6020 ± 526 | 6560 ± 456 | 6140 ± 786 |
| 99 | 279 ± 12 | 404 ± 75 | 288 ± 8 |
| 100 | 2030 ± 15 | 2510 ± 413 | 2430 ± 9 |
| 101 | 1480 ± 564 | 659 ± 43 | 511 ± 65 |
| 102 | 577 ± 61 | 598 ± 83 | 457 ± 24 |
| 103 | 254 ± 6 | 204 ± 2 | 181 ± 7 |
| 104 | 1150 ± 27 | 1730 ± 87 | 1030 ± 70 |
| 105 | 2620 ± 65 | 4750 ± 126 | 4990 ± 345 |
| 106 | 139 ± 5 | 159 ± 16 | 148 ± 15 |
| 107 | 874 ± 68 | 528 ± 20 | 524 ± 36 |
| 108 | 376 ± 25 | 281 ± 32 | 313 ± 57 |
| 109 | 191 ± 18 | 198 ± 18 | 219 ± 40 |
| 110 | 1690 ± 356 | 2720 ± 315 | 2420 ± 154 |
| 111 | 444 ± 12 | 451 ± 8 | 439 ± 29 |
| 112 | 547 ± 71 | 859 ± 13 | 610 ± 24 |
| 113 | 90.8 ± 1.3 | 97.5 ± 4.6 | 64.9 ± 2.8 |
| 114 | 5680 ± 6 | 6420 ± 85 | 6720 ± 41 |
| 115 | 6.39 ± 0.15 | 5.14 ± 0.50 | 7.39 ± 0.6 |
| 116 | 8920 ± 317 | 15440 ± 491 | 8010 ± 140 |
| 117 | 29.0 ± 1.1 | 26.8 ± 0.3 | 25.9 ± 0.4 |
| 118 | 3320 ± 213 | 2620 ± 53 | 1780 ± 187 |
| 119 | 6440 ± 477 | 8280 ± 386 | 3780 ± 82 |
| 120 | 79.5 ± 9.0 | 83.1 ± 1.4 | 84.1 ± 3.0 |
| 121 | 7700 ± 137 | 10200 ± 221 | 4530 ± 141 |
| 122 | 6210 ± 326 | 11400 ± 582 | 14300 ± 589 |
a
Cytotoxicity results are expressed as GI50 values, the compound concentration producing a 50% cell growth inhibition and represent the mean ± SD of three independent experiments. Values under 100 nM are highlighted for easier comparison.