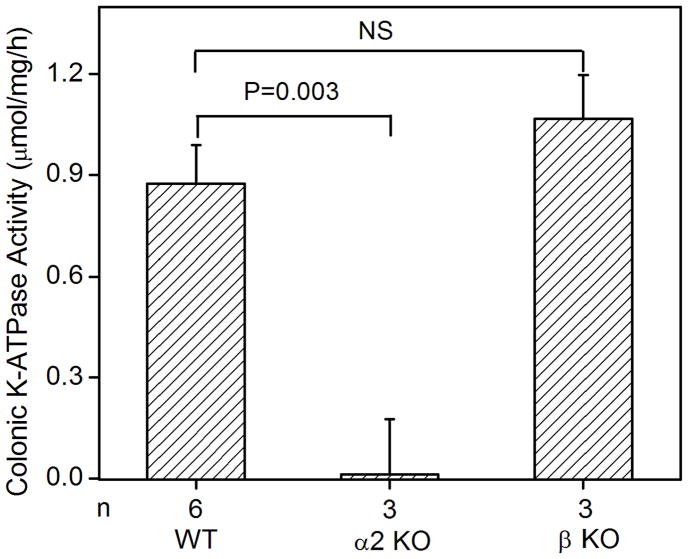
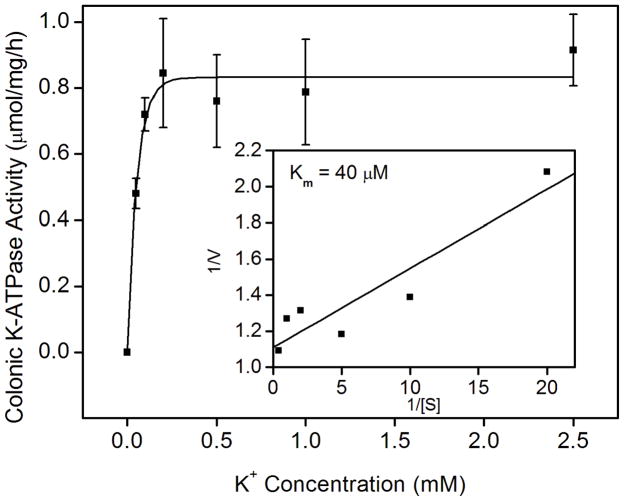
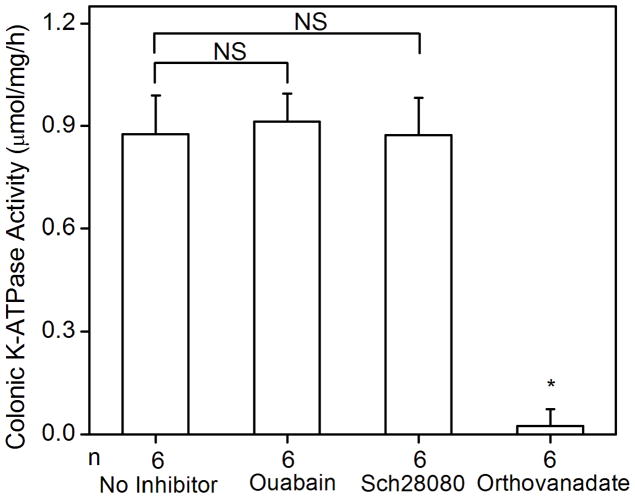
Fig. 2.
K-ATPase activity in the colonic membrane vesicles of mice. (A) Colonic K-ATPase activity was determined in the colonic membrane vesicles of HKα2 wild type (WT), HKα2 knockout (α2 KO), and HKβ knockout (β KO) mice. Values (in micromole ATP hydrolyzed per mg membrane protein per hour) are means ± se from the indicated number of animals (n). Comparisons between groups were performed by Student’s t-test. NS stands for no statistically significant difference between groups. (B) K-dependent ATPase activity was measured in the colonic membrane vesicles extracted from wild type mice. Maximal stimulation of K-ATPase activity was reached at K+ concentration of 200 μM. Inset, Lineweaver-Burk plot of 1/V versus 1/[S] indicates apparent Km of 40 μM for the colonic K-ATPase activity. (C) Colonic K-ATPase activity was measured in the absence of inhibitor or in the presence of 2 mM ouabain, or 100 μM Sch28080, or 100 μM orthovanadate. Values are means ± se from the indicated number of animals (n). * indicates P<0.001, statistically different from the colonic K-ATPase activity in the absence of inhibitor by Student’s t-test.


