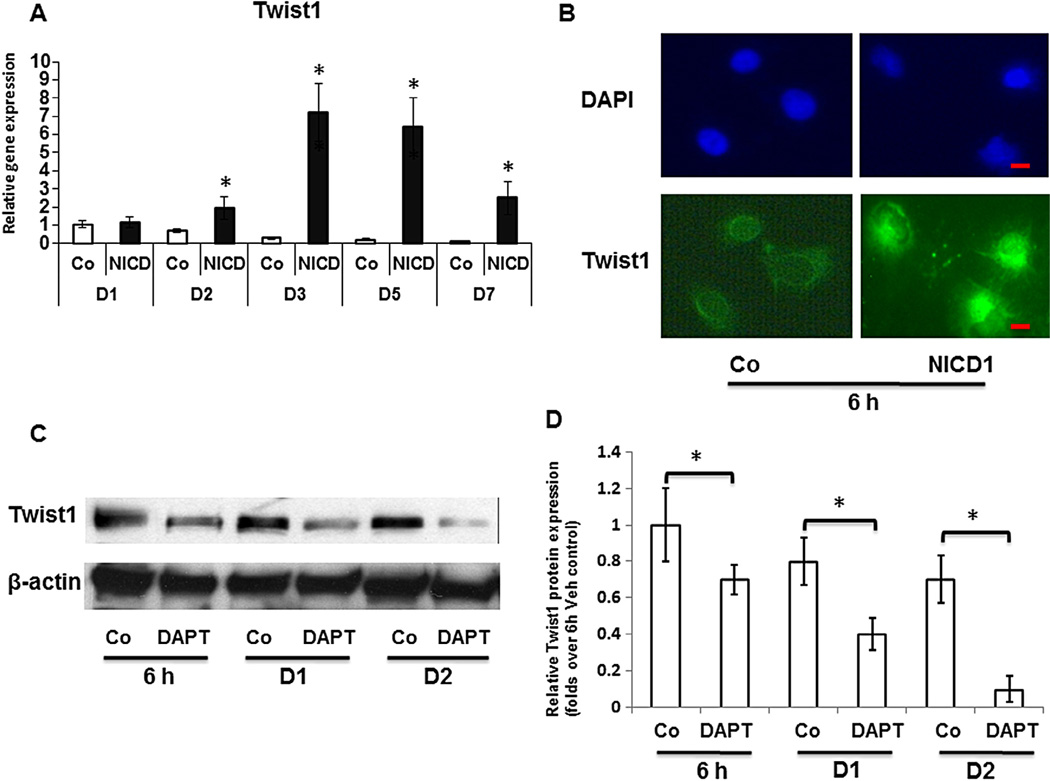
Fig. 2.
Up-regulation of Twist1 expression by Notch signaling in limb bud mesenchymal progenitor cells. (A) Real time PCR analysis reveals that overexpression of NICD1 increased Twist1 RNA levels in the limb bud cells at time points from 2 to 7 days, with a maximal increase at day 3 when compared to control cells (Co). (B) Immunofluorescence assays show that in control cells endogenous Twist1 is localized to the cytoplasm. In contrast, there is a marked increase in peri-nuclear and nuclear labeling of Twist1 in limb bud cells after transit transfection with 3XFLAG NICD1 expressing plasmids for 6 h. Cells were counterstained with DAPI (blue). Scale bars, 5 µm. (C)Western blot shows Twist1 protein levels were visibly reduced by DAPT (10 µM, daily) treatment in MPC micromass culture from 6 h to 48 h. DMSO treated MPC was used as control (Co) and β-actin was used as a loading control. (D) Quantification of Twist1 protein level in Western blots was determined by measuring band intensity. Data are means ± s.d. of three independent experiments. (*, P < 0.05 compared with control at same time point; #, P < 0.05 compared with control at 6 h.) (For interpretation of the references to color in this figure legend, the reader is referred to the web version of this article.)

