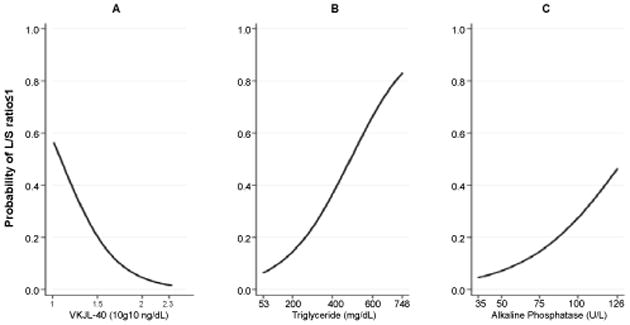
Figure 3.

Final logistic model prediction A. Calculated probability of L/S ratio ≤ 1.0 as the concentration of YKL-40 increased over the observed biomarker range with all other covariates held constant. B. Calculated probability of L/S ratio ≤ 1.0 as triglyceride increases C. Calculated probability of L/S ratio ≤ 1.0 as ALP increases. L/S ratio: Liver/Spleen attenuation ratio; ALP: Alkaline phosphatase.
