Figure 3.
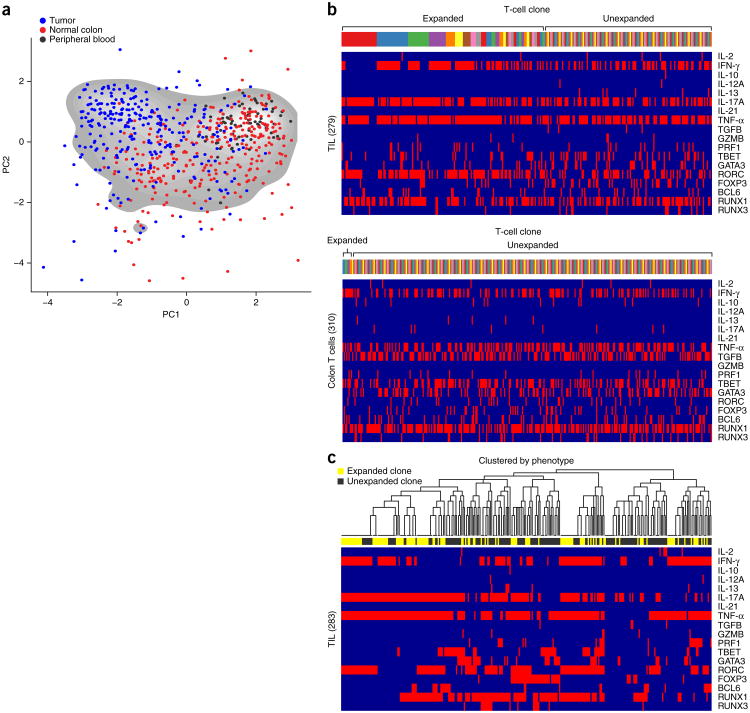
TCR sequencing and phenotypic analysis of single human TILs. (a) T cells were sorted and analyzed using the procedure from Figure 1a. PCA to depict phenotypic diversity of PMA- plus ionomycin-stimulated CD4+ T cells from tumor (blue) and adjacent colon (red) of a single patient, and from peripheral blood of another healthy donor (black). PCA parameter loadings are shown in Supplementary Figure 7. Each dot represents a single T cell. (b) Top two panels: 17-parameter (parameters listed on x axis) phenotypic analysis of stimulated CD4+ T cells from tumor (top) and colon (bottom) of a single patient. Individual T cells are grouped by TCR sequence; each color on the bar above the heat maps represents a distinct TCR sequence. (c) Hierarchical clustering of different cells by phenotype, with expanded (yellow) and unexpanded (black) T-cell clones (read out by TCR sequence) indicated in the horizontal bar above the heat map.

