Figure 1.

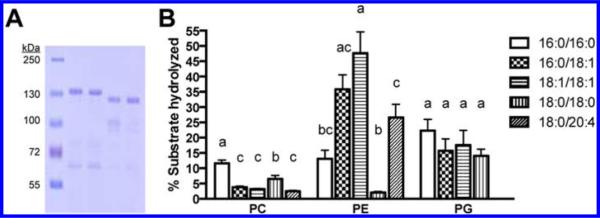
(A) SDS-PAGE analysis of purified recombinant PldA. Lane 1, molecular weight ladder; lane 2, wild type PldA; lane 3, PldA K169E; lane 4, tagless wild type PldA; lane 5, tagless PldA K169E. (B) PldA displays variable substrate hydrolysis based on phospholipid fatty acyl chain composition. 18:0/20:4 PG was not assayed. Mean values are shown ± SEM (n = 9). Statistical analysis performed using one-way ANOVA with Tukey's post hoc test. Groups differing (p < 0.05) have different letters.
