
Figure 9.
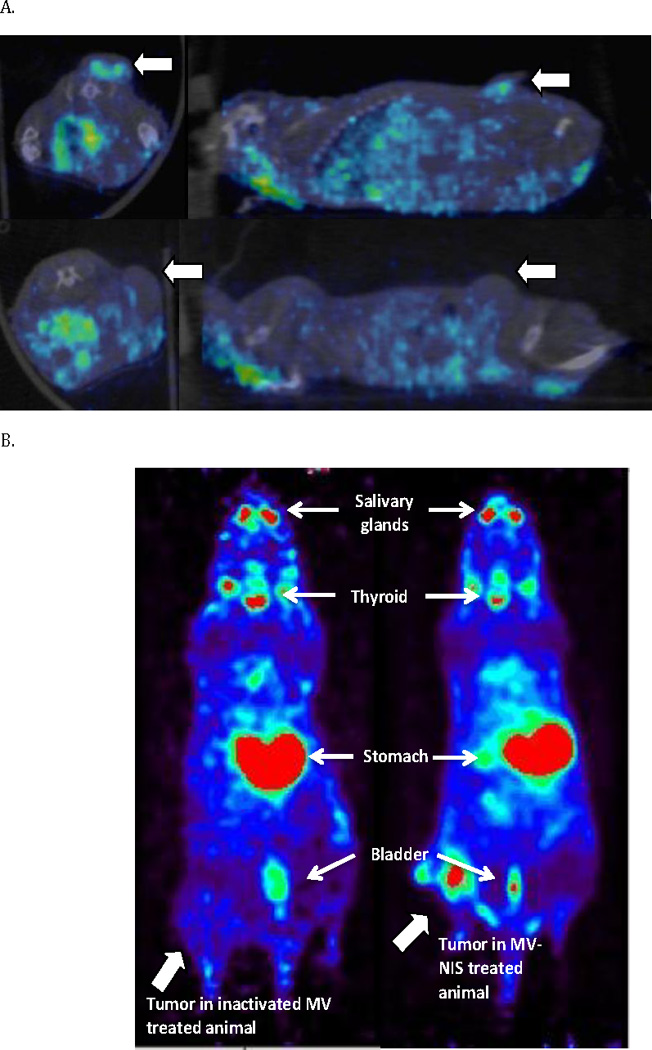
MV-NIS treatment allows real-time in vivo imaging of viral replication. After two weeks of MV-NIS therapy OS xenografts were imaged by CT-SPECT or PET-CT. (A) Flank xenografts treated every four days for two weeks with intratumoral injections of 1×10⁶ TCID50 were imaged by CT-SPECT. Representative image shows uptake of Tc-99m in flank tumors (large arrows) of MV-NIS treated (9A, upper panel), but not inactivated virus treated animals (9A, lower panel). (B) Orthotopic tibial xenografts were treated intravenously every four days for two weeks with 1×10⁶ TCID50 MV-NIS. They were subsequently imaged by PET-CT after F-18 TFB administration. In contrast to MV-NIS treated animals (9B, right panel), no significant uptake was seen in control virus treated mice (9B, left panel).