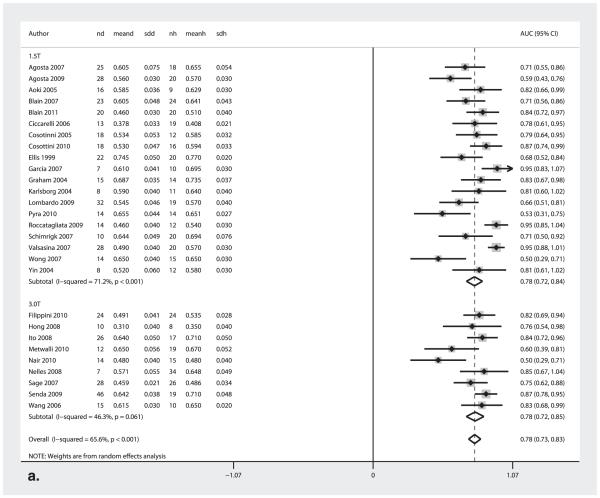
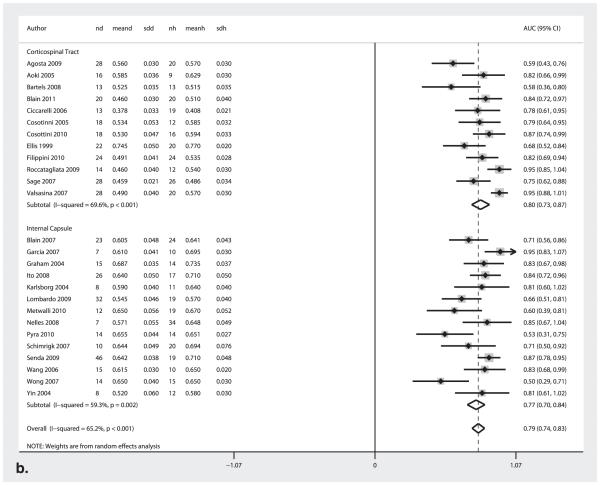
Figure 4.
AUC Forest plots for (a) 1.5T and 3.0T MRI field strength and (b) corticospinal tract and internal capsule. The center point represents the point estimated AUC for the respective study and; the horizontal line, the 95% confidence interval (CI) for the respective study. The vertical broken line represents the pooled AUC and the boundaries of the hollow diamond represent the 95% CI of the pooled results. nd, number of diseased; meand, mean fractional anistropy (FA) of diseased; sdd, standard deviation FA of diseased; nh, number of healthy controls; meanh, mean FA of healthy controls; sdh, standard deviation FA of healthy controls; AUC, area under the curve.


