
Figure 6.
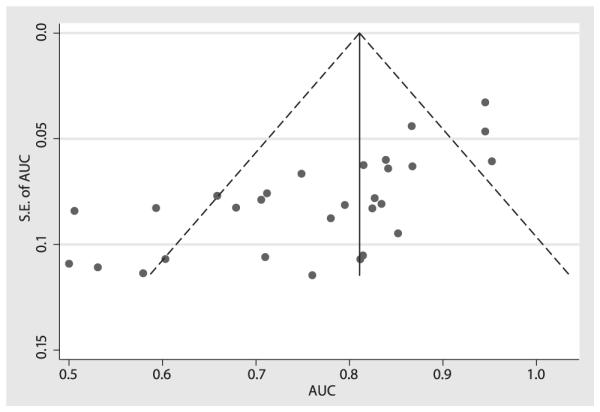
Assessing publication bias. The funnel plot horizontal axis expresses treatment effect, in this instance, measured by area under the receiver operating characteristic curve (AUC). The vertical axis expresses study size, as measured by standard error (SE). Studies with larger standard errors have a wider confidence interval from smaller sample size. The graphed vertical line represents the observed mean AUC and the dashed lines represent the 95% confidence interval limits for the expected distribution for published studies. The points represent the observed distribution of the published studies. Visual inspection of the plot demonstrates the presence of publication bias, with many studies outside the 95% confidence interval limits. Further, the plot demonstrates that studies with smaller study size (ie, larger standard errors) have lower test performance (ie, AUC).