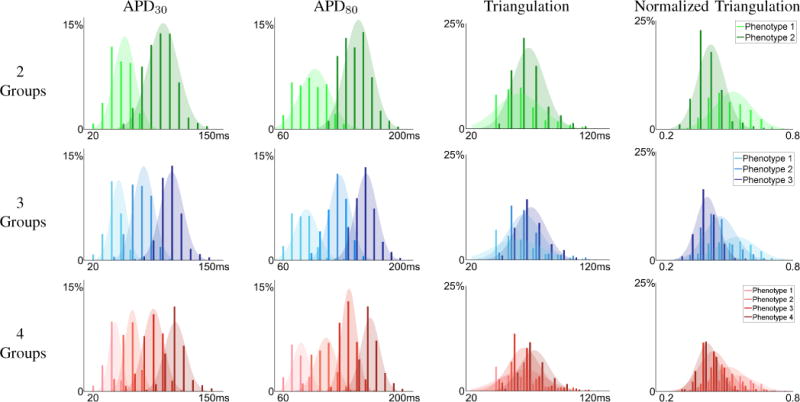
Fig. 4.

Morphological Feature Distributions. Distribution APD30 (first column), APD80 (second column), triangulation (APD90 – APD30) (third column), and normalized triangulation , rightmost column), for the spectral grouping result using 2 (top row), 3 (middle row), and 4 (bottom row) groups. The two group segmentation suggest two unique phenotypes in APD30, APD80, and normalized triangulation.
