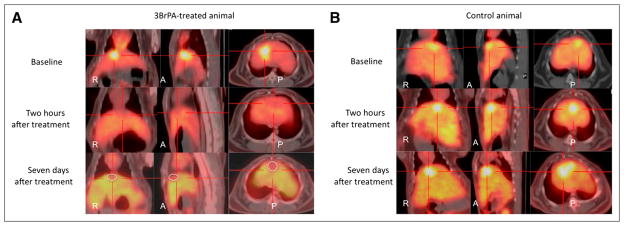
FIGURE 2.

(A) Fused 18F-FDG PET/CT images (axial, coronal, and sagittal views) of VX2 liver tumor at 24 h before treatment with 3-BrPA, 2 h after treatment, and 1 wk after treatment. Tumor 18F-FDG uptake progressively decreases over time, and central necrosis develops in tumor after treatment (circle). (B) Fused 18F-FDG PET/CT images (axial, coronal, and sagittal views) of VX2 liver tumor at 24 h before treatment with saline, 2 h after treatment, and 1 wk after treatment. Tumor 18F-FDG uptake progressively increases over time. A = anterior; P = posterior.
