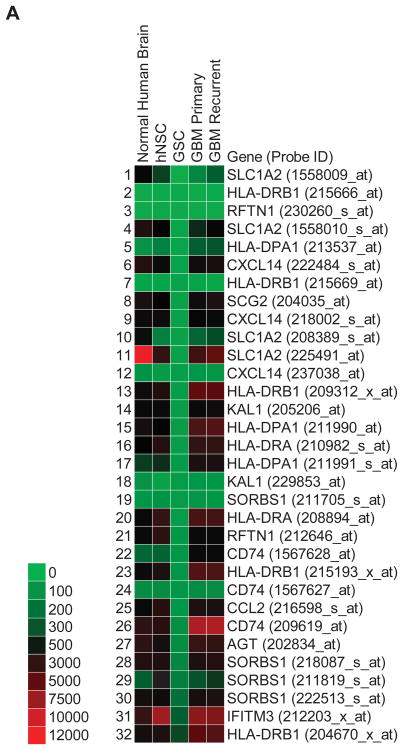
Figure 2.
Thirteen downregulated plasma membrane GSC-specific transcripts. Heat map with accompanying color key of raw intensity values from gene expression profiles generated from Affymetrix U133 Plus 2.0 arrays and processed with Geospiza GeneSifter (PerkinElmer). Data was filtered for plasma membrane transcripts and gated for GSC values less than 10-fold change below all other samples. Acronyms correspond to official gene symbols found online at the National Center for Biotechnology Information. Multiple probe sets shown to demonstrate internal reproducibility.

