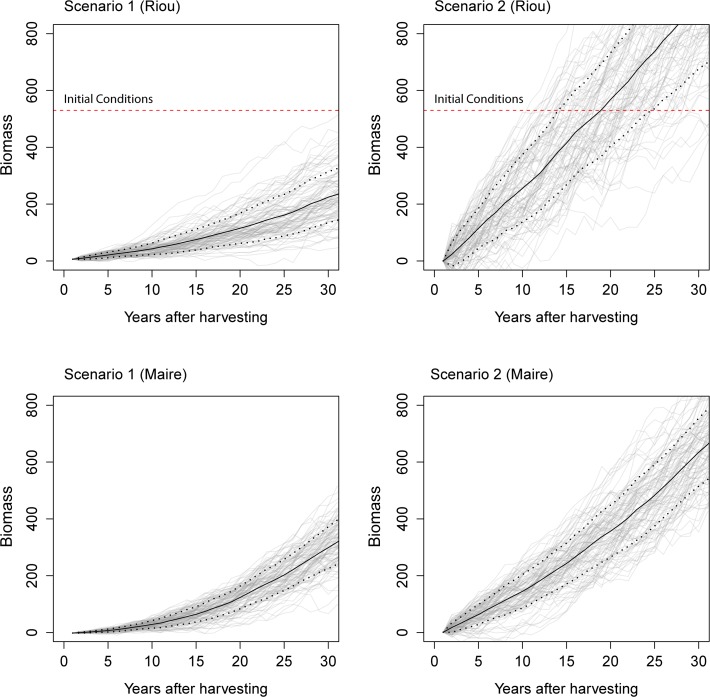
Fig 5. Biomass projections of red coral populations to compare different harvesting scenarios.
Scenario 1) 90% total mortality and 10% partial mortality. Scenario 2) 10% total mortality and 90% partial mortality. Horizontal broken lines show initial conditions at Riou. Black lines represent the mean trend and dot lines the standard deviation (n = 100).

