
Table 2.
Comparison of anthropometric, biochemical, BIA data, and clinical outcomes among the different nutrition status groups
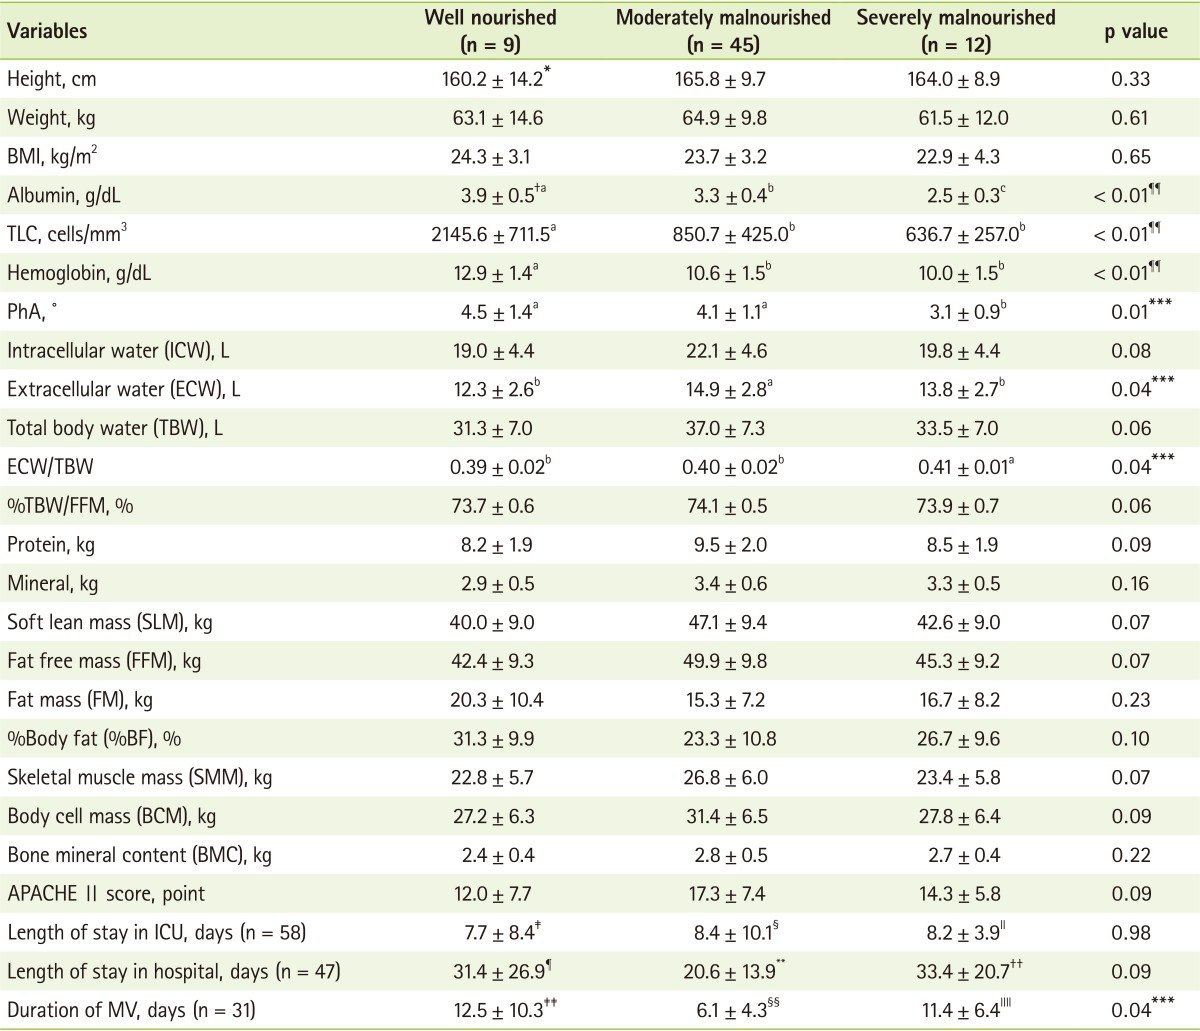
BMI: body mass index, TLC: total lymphocyte count, PhA: phase angle, ECW/TBW: extracellular water/total body water, TBW/FFM: total body water/fat free mass, ICU: intensive care unit, MV: mechanical ventilation.
*Mean ± Standard Deviation; †Significant difference (p < 0.05) is indicated by lowercase alphabets based on analysis of variance with Bonferroni correction; ‡n = 9; §n = 39; lln = 10; ¶n = 7; **n = 31; ††n = 9; ‡‡n = 4; §§n = 22; lllln = 5; ¶¶p < 0.01; ***p < 0.05.