
Table 3.
Pearson's correlation coefficients between BIA data and BMI and biochemical data (n = 66)
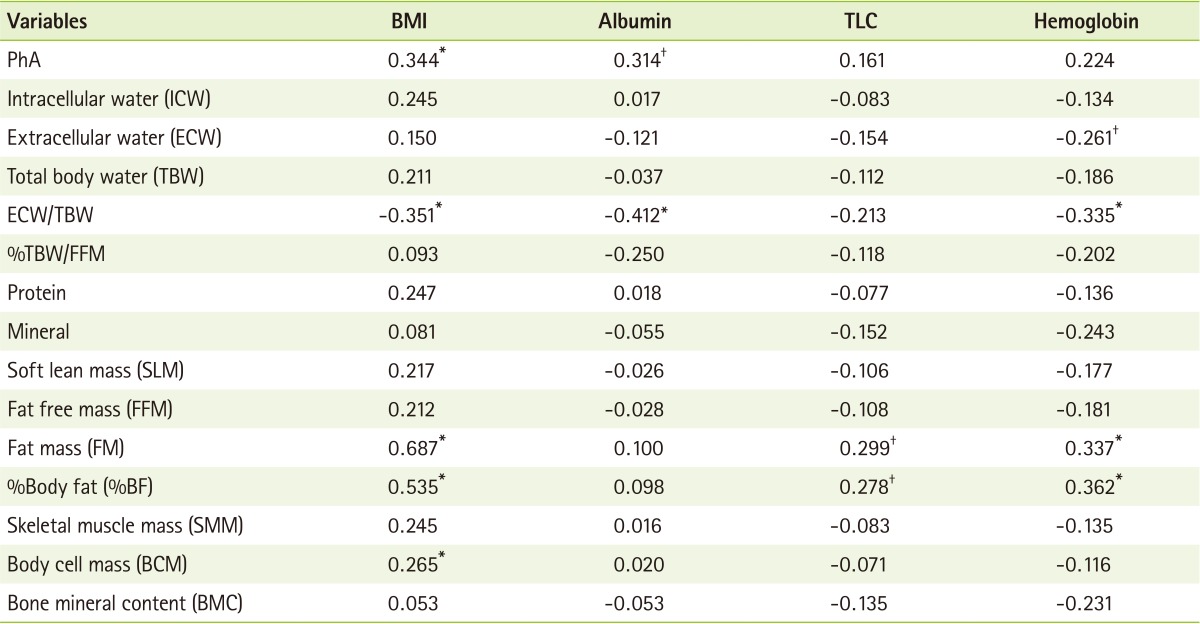
Adjusted for age and APACHE II score.
BMI: body mass index, TLC: total lymphocyte count, PhA: phase angle, ECW/TBW: extracellular water/total body water, TBW/FFM: total body water/fat free mass.
*p < 0.01; †p < 0.05.