
Table 5.
Comparison of BMI, biochemical data, and BIA data between survivors and non-survivors
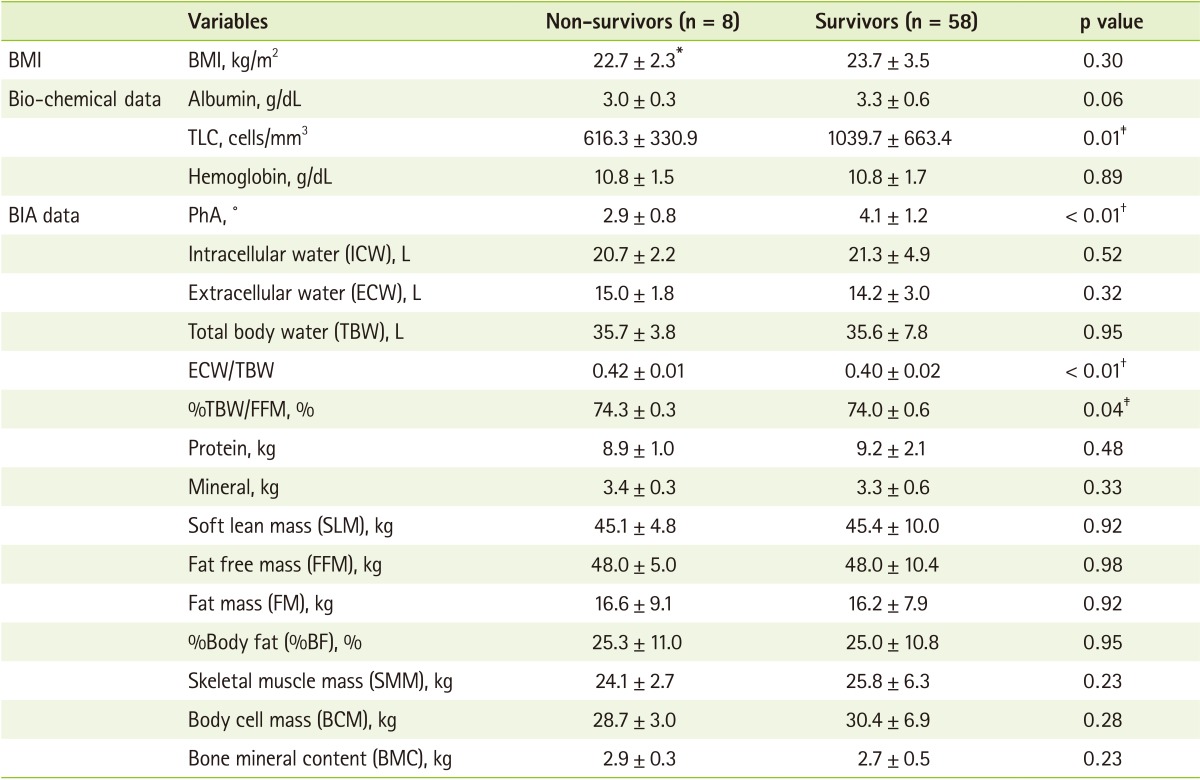
BMI: body mass index, TLC: total lymphocyte count, BIA: bioelectrical impedance analysis, PhA: phase angle, ECW/TBW: extracellular water/total body water, TBW/FFM: total body water/fat free mass.
*Mean ± Standard Deviation; †p < 0.01; ‡p < 0.05.