
Fig. 1.
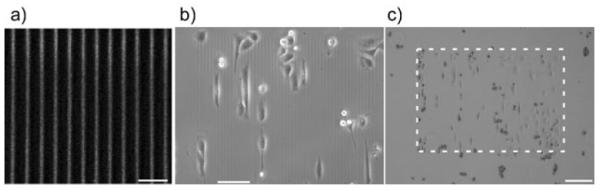
maging of the crosslinked laminin structures used for the migration and cytoskeletal studies. (a) Immunofluorescence imaging of the crosslinked laminin fibers, scale bar = 20 microns; (b) 10× phase contrast showing OVCA433 cells on the laminin fibers, scale bar = 100 microns; (c) 4× phase contrast showing cells on the pattern (delineated by the dashed box) and those located on the background BSA monolayer, scale bar = 200 microns.