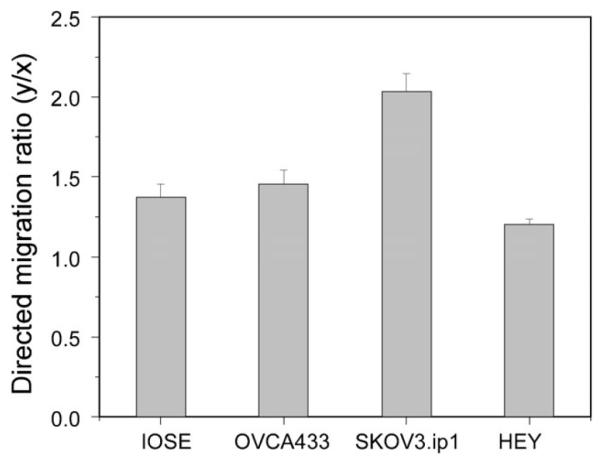
Fig. 3.
irectional migration data for the four cell lines, plotted in terms of y/x displacement where y corresponds to the laminin fiber axis. All cell lines have ratios greater than one, indicating the importance of contact guidance. The corresponding p values from pairwise t-tests are given in Table 2.

