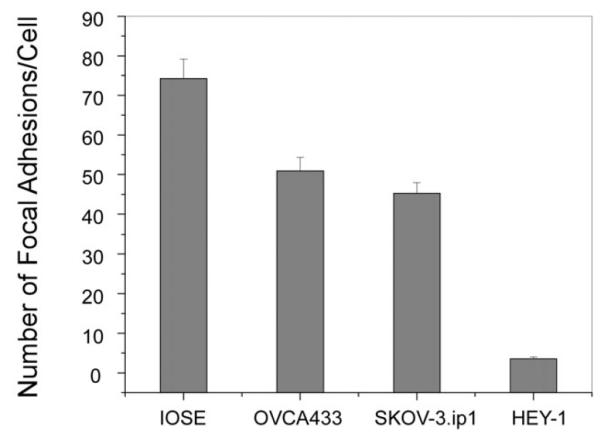
Fig. 6.

ar graph of the average numbers of focal adhesions for the IOSE, OVCA433, SKOV-3.ip1, and HEY-1 cells where the error bars represent the standard error. The resulting p values are given in Table 3.

ar graph of the average numbers of focal adhesions for the IOSE, OVCA433, SKOV-3.ip1, and HEY-1 cells where the error bars represent the standard error. The resulting p values are given in Table 3.