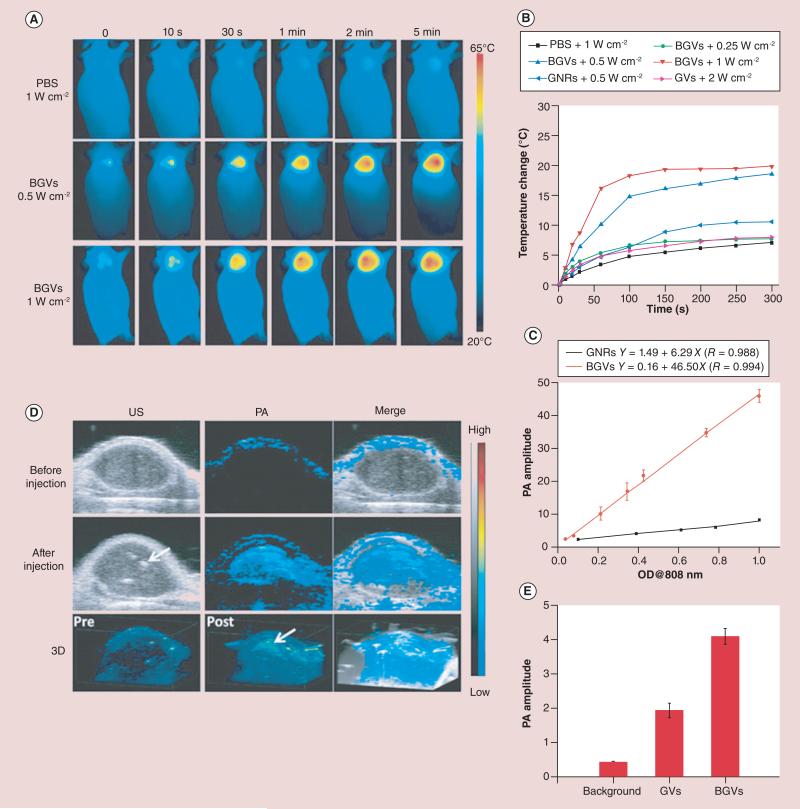
Figure 9. Photothermal and photoacoustic imaging of tumors injected with biodegradable gold nanovesicles.
(A) Thermal images of MDA-MB-435 tumor-bearing mice exposed to an 808-nm laser for 5 min after the injection of PBS or BGVs. (B) Heat curves of tumors upon laser irradiation as a function of irradiation time. (C) PA signals of BGVs and GNRs as a function of optical density. (D)In vivo 2D US and PA images and 3D PA images of tumor tissues before and after the injection of BGVs. Arrows indicate the location of BGVs. (E) PA intensities of tumor tissues following the intratumoral administration of the same amount of GVs or BGVs.
Data points and error bars represent in (B, C & E) are given as means ± standard deviation.
BGV: Biodegradable gold nanovesicle; GNR: Gold nanorod; GV: Gold vesicle; OD: Optical density; PA: Photoacoustic; PBS: Phosphate-buffered saline; US: Ultrasound.

