Figure 1.

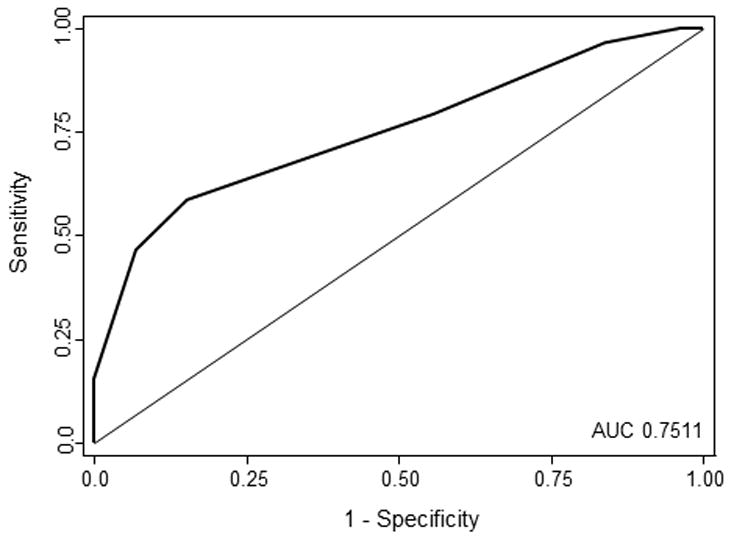
The ROC curve for the score model predicting PEG placement in the entire sample is shown. An area under the curve (AUC) of 0.7511 shows that the model is predictive of PEG placement.

The ROC curve for the score model predicting PEG placement in the entire sample is shown. An area under the curve (AUC) of 0.7511 shows that the model is predictive of PEG placement.