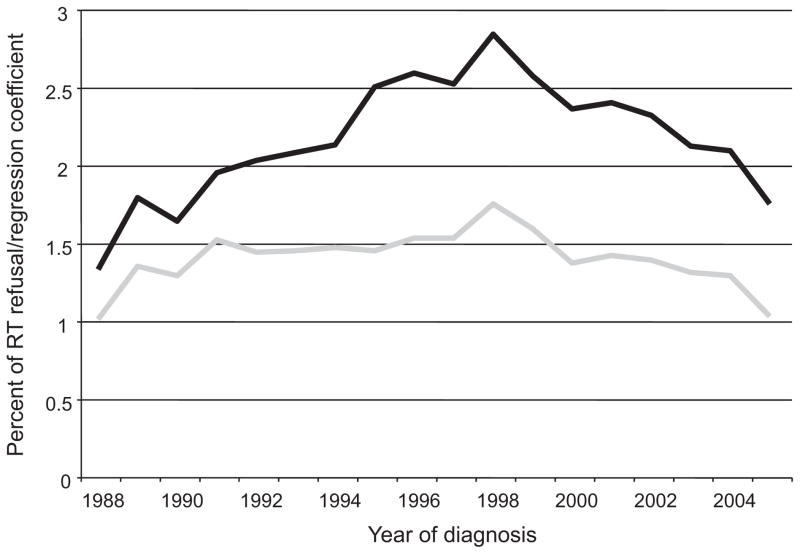
FIGURE 1.
Rate of RT refusal by year of diagnosis (black line) and associated regression coefficient (gray line). The latter value represents the coefficient associated with each year of diagnosis for a binary logistic regression model of RT refusal (1988 equals the reference category). See Table 3 for regression coefficients of other significant variables in the final model.

