
Figure 2. Widespread sharing of microbial taxa between human and home surfaces.
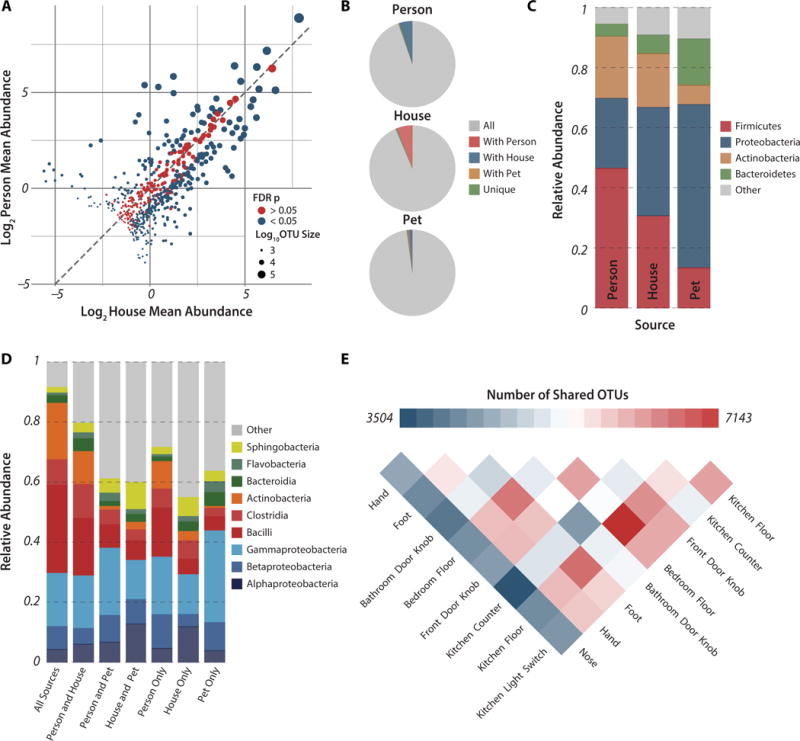
(A) Plot of log2-transformed average relative abundances in the human and home environments for all OTUs in the study with greater than 500 reads. OTUs are colored by whether their average relative abundance is significantly different between the home and person environments based on the FDR corrected p-value from a non-parametric t-test run with 1,000 permutations, and are sized based on their log10-transformed number of reads. The dashed line is y=x, indicating an equal average relative abundance. (B) Fraction of all reads from within a source belonging to OTUs shared with other sources, demonstrating the ubiquitous sharing of OTUs between homes and the humans and pets that occupy them. The percent of reads that cluster within source-specific OTUs is less that 0.6% for all three sources. (C) Taxonomic summary of observed relative abundance of abundant phyla across all samples divided by source. (D) Taxonomic summary of observed relative abundance of taxa at class level for all reads in the study by source-specific OTU overlap. (E) Shared phylotypes heatmap for individual surfaces after consolidation of samples taken from the same surface type across temporal sampling series and homes. Pooled samples were rarified to an even depth of 277,500 reads.