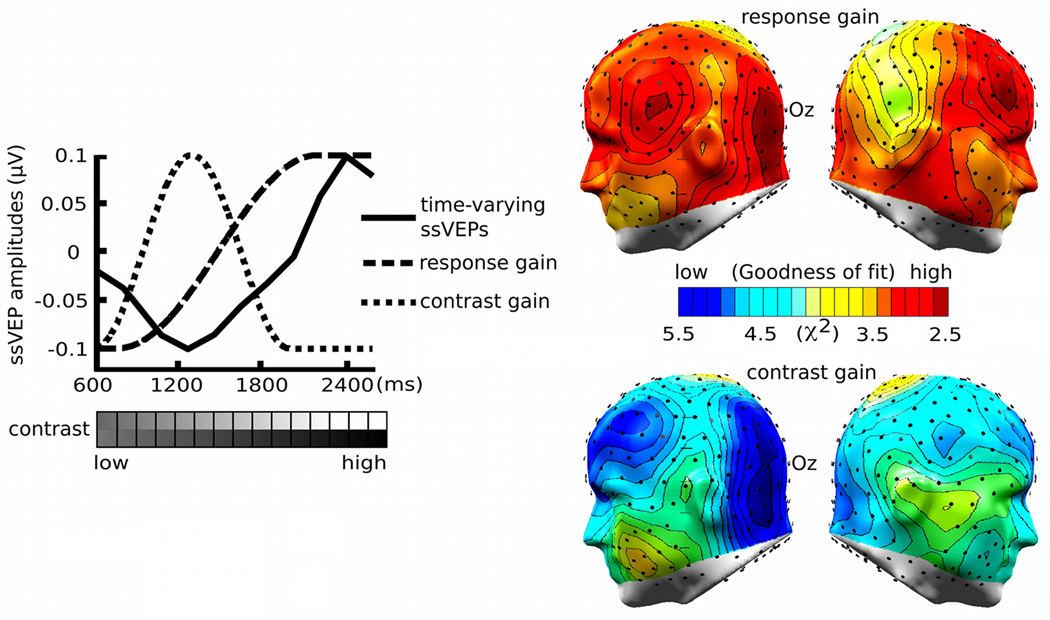
Figure 5.
Normalized time-varying ssVEP amplitudes during the waxing-contrast phase of the acquisition block and the chi-square Goodness-of-fit tests of the response and contrast gain models. The solid line is for the range-corrected time-varying amplitude difference between the CS+ and the CS− condition, the dashed line is for the simulated response gain model, and the dotted line is for the simulated contrast gain model. The chi-square goodness-of-fit tests on conditioning-induced amplitude differences showed that the response gain model was a better fit to the conditioning effects on neural mass population activity in the slightly lateralized visual cortex (posterior sensor clusters around Oz), compared to the contrast gain model. The chi-square values over the left and right hemispheres are demonstrated by the topographies, which depict the lowest chi-square value as dark red and the highest as dark blue.

