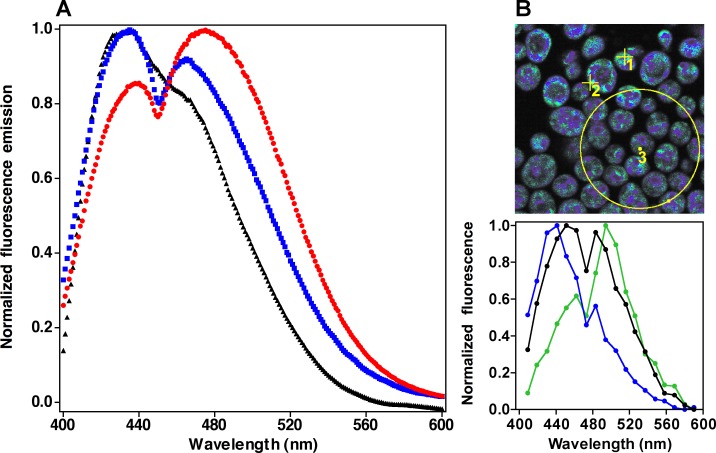
Fig 1. Fluorescence response of DAN probes in resting cells.
Panel A) Emission spectra of cells labeled with ACDAN (red), PRODAN (blue) and LAURDAN (black) measured in the fluorometer. Panel B) Spectral image of cells labeled with ACDAN (top) with spectra (bottom) of selected regions of interest: single B region (blue, ROI 1), single G region (green, ROI 2), and the overall spectrum (black, large circle defines ROI 3). Spectral resolution in the microscope is lower than in the spectrofluorometer. Image size is 15 x 15 μm. The spectral images of PRODAN and LAURDAN are not shown.

