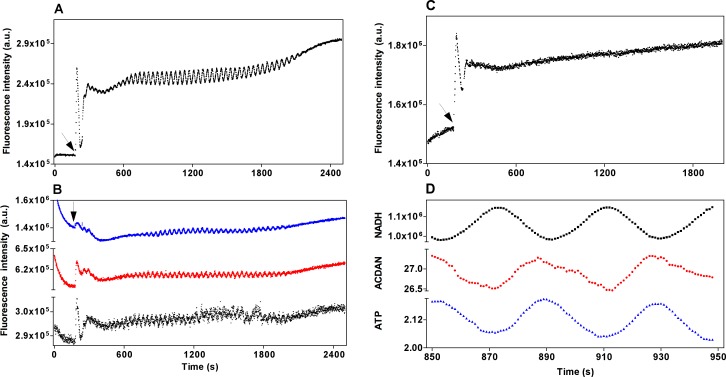
Fig 2. Oscillatory behavior of glycolysis and DAN probes in the fluorometer.
Panel A) Oscillations of NADH. Panel B) Oscillations of ACDAN (red), PRODAN (blue) and LAURDAN (black). Panel C) Non-oscillatory behavior of ANS labeled cells. Panel D) Phase relationships: ACDAN and NADH are expressed as fluorescence intensity, ATP is plotted in concentration units (mM). The arrows in panels A), B), and C) indicate the time of addition of 30 mM glucose followed by 5 mM KCN.

