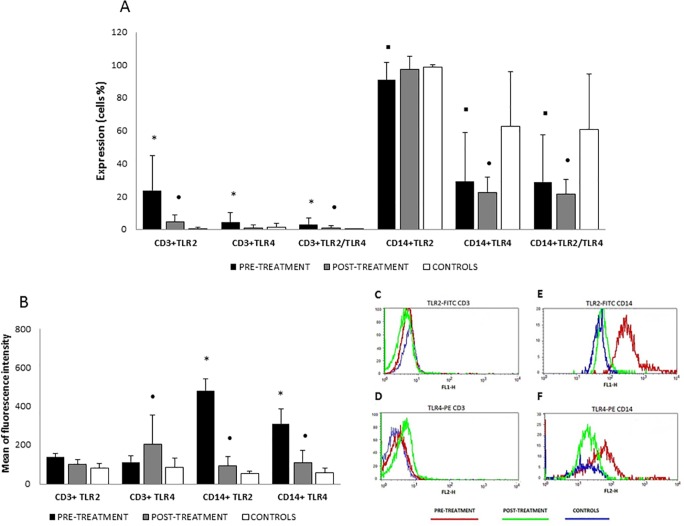
Fig 1. Expression of surface TLR2 and TLR4.
Frequency of CD3+ and CD14+ cells expressing TLR2, TLR4 and co-expressing TLR2 and TLR4 (A) and mean of fluorescence intensity (B) of TLR2 and TLR4 in CD3+ and CD14+ cells in whole blood from patients with visceral leishmaniasis pre-treatment, post-treatment and control subjects. Gating strategies to distinguish between cell populations analyzed by flow cytometry. FSC-SSC profile was used to distinguish total lymphocytes and monocytes and these subtype cells were gated according to light scatter profile and the expression of CD3 or CD14. Representative histograms plots of TLR2 and TLR4 expression in CD3+ (C,D) and CD14+ (E,F) cells. The results are expressed as the mean and standard deviation. *p<0.05 compared pre-treatment vs. post-treatment and control subjects; ▪ p<0.05 compared pre-treatment vs. control subjects and • p<0.05 compared post-treatment vs. control subjects.

