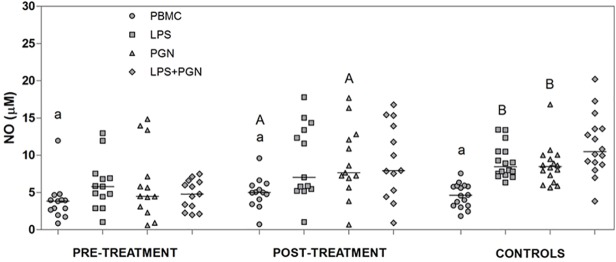
Fig 3. NO production after stimulation with LPS and PGN agonists.

Levels of NO in supernatants were analyzed after 24 hours of PBMCs cultured (1x10⁶ cells/ml), obtained from patients with VL pre-treatment, post-treatment and control subjects, and stimulated or not with LPS ultra-purified (1 μg/ml), PGN (5 μg/ml) and LPS+PGN. Lowercase letters represent significant differences among agonists in the same group: p<0.05 a—PBMC vs. LPS, PGN, LPS+PGN. Capital letters represent significant differences in the same agonists among groups: p<0.05 A—pre-treatment vs. post-treatment; B—pre-treatment vs. control individuals. Each dot represent a different patient and each bar represents the median. NO levels were measured by the levels of nitrite/nitrate and the data are representative of triplicates.
