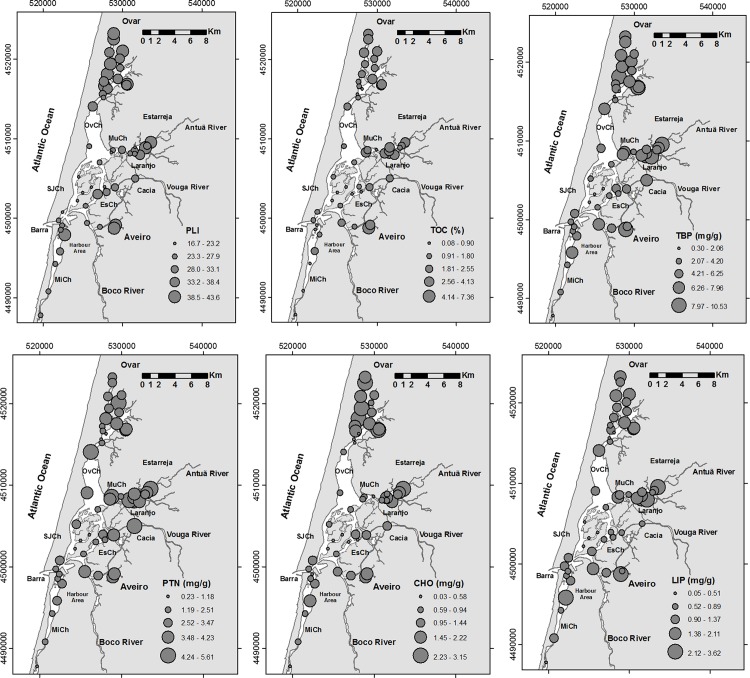
Fig 3. Distribution maps of: Pollution Load Index (PLI) values, total organic carbon (TOC, %) content, total concentrations of biopolymers (TBP, mg/g) and concentrations of proteins (PTN, mg/g), carbohydrates (CHO, mg/g) and lipids (LIP, mg/g).
Legend: OvCh—Ovar Channel, SJCH—São Jacinto Channel, MuCh—Murtosa Channel, EsCh—Espinheiro Channel, MiCh—Mira Channel.

