
Fig 6. ANS binding to IMPDHpa and IMPDHbt.
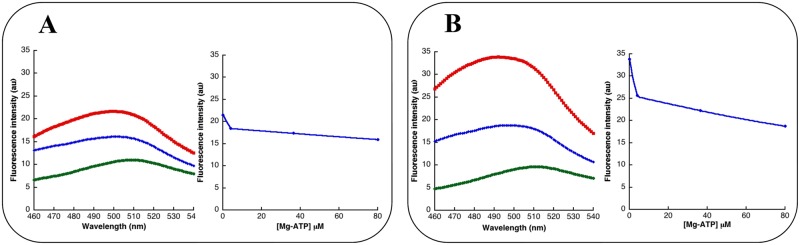
(A) Left panel: ANS fluorescence spectra alone at 10 μM (green), in the presence of 1 μM IMPDHpa without (red) or with 100 μM ATP (blue). Right panel: fluorescence intensity measured at 495 nm as a function of MgATP concentration. (B) The same curves for IMPDHbt.