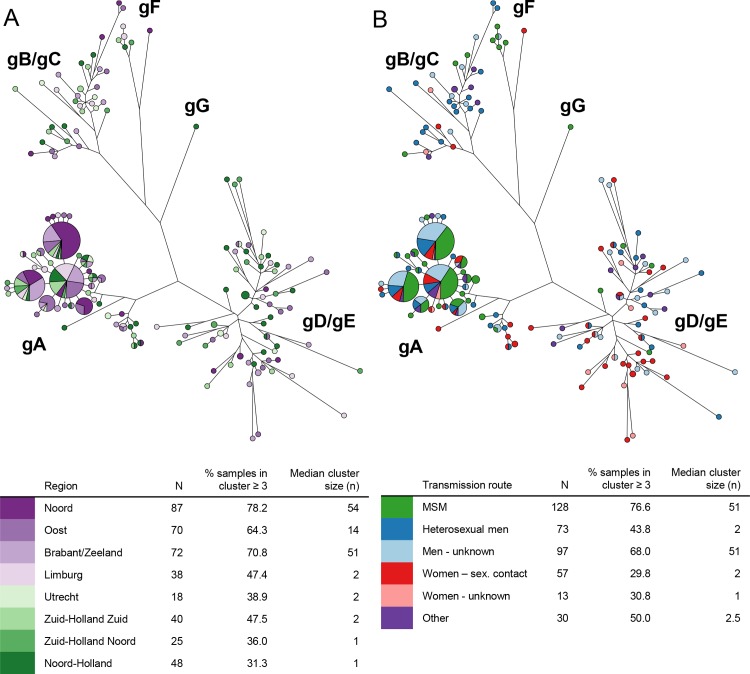
Fig 3. Maximum parsimony trees of HBV cases (2009–2013) in the Netherlands based on C-gene sequences (N = 400), by region (Fig. 3A) and most probable mode of transmission (Fig. 3B).
(3A: purple = rural areas, green = urban areas; Genotypes: gA = genotype A, gB = genotype B, gC = genotype C, gD = genotype D, gE = genotype E, gF = genotype F, gG = genotype G; patients with indistinguishable sequences are displayed together in one node and the size of the node is relative to the number of indistinguishable sequences)

