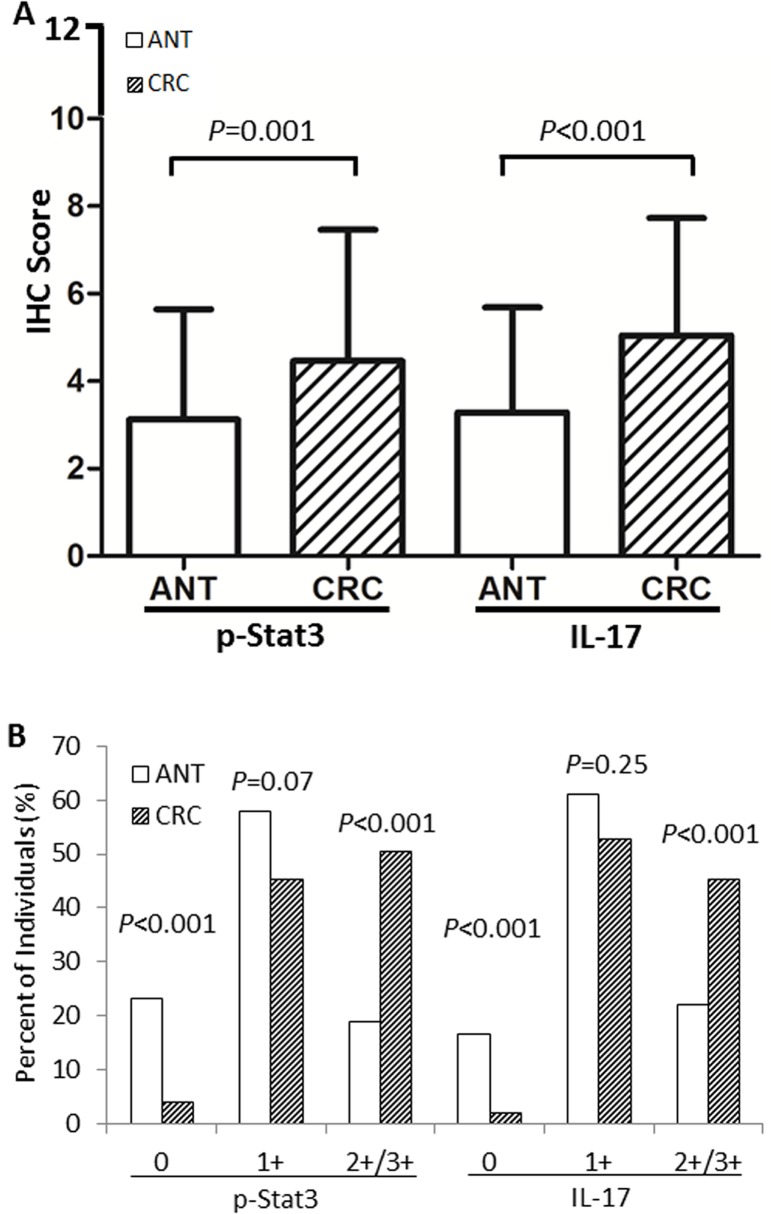
Fig 2. CRC tissues show over-phosphorylation of Stat3 (p-Stat3) and overexpression of IL-17 when compared with ANT.
(A) Based on the scoring criteria (Table 1), pooled scores for p-Stat3 or IL-17 are compared between CRC and ANT individuals using t-test and the data are expressed as mean ± standard deviation (M±SD). As seen, constitutive p-Stat3 is higher in CRC than in ANT (M±SD, 4.5±3.0 vs 3.1±2.5, P = 0.001). Similarly, expressed IL-17 is also higher in CRC than in ANT (M±SD, 5.0±2.7 vs 3.3±2.4, P<0.001). (B) Comparison between CRC and ANT for the number of individuals (%) with varying staining intensities using χ2 test. As shown for p-Stat3, CRC category has less individuals scored as 0 than ANT category (4.2% vs 23.3%, P<0.001). To the contrary, CRC has many more individuals scored as strong positives (2+/3+) than ANT (50.5% vs 18.9%, P<0.001). A striking similarity is true for IL-17, of which CRC category has less individuals scored as 0 than ANT category (2.1% vs 16.7%, P<0.001) but again, CRC has many more individuals scored as stronger positives 2+/3+ than ANT (45.3% vs 22.2%, P<0.001). For both p-Stat3 and IL-17, staining intensity of weak positivity (1+) is not significantly different between CRC and ANT categories (P = 0.07 and P = 0.25, respectively). ANT indicates adjacent normal tissues and CRC depicts colorectal cancer, respectively.

