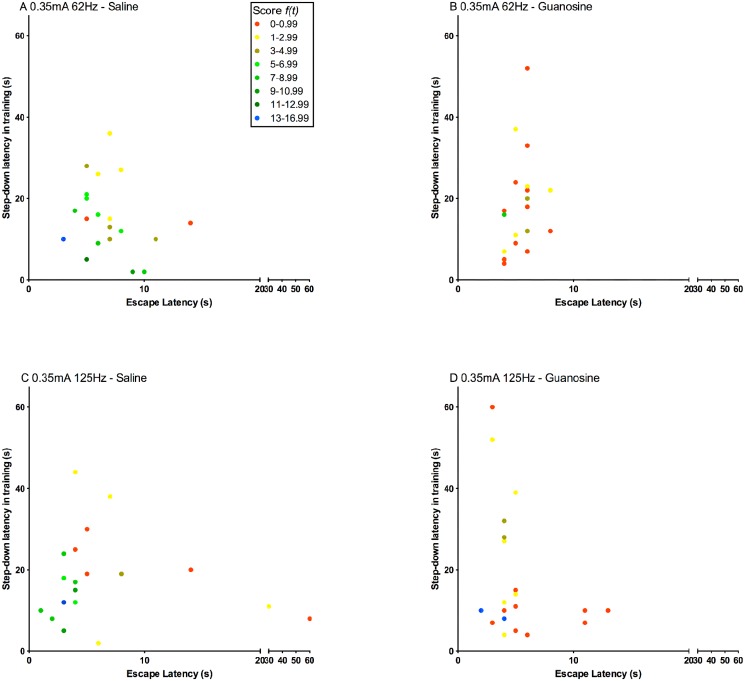
Fig 9. Platform exploration time in training (step-down latency in training) and time of stimulus (escape latency) influence on learning.
The scale of colors indicates the animals score based in Equation 2. (A) Saline group exposed at 0.35mA, 62Hz. (B) Guanosine group exposed at 0.35mA, 62Hz. (C) Saline group exposed at 0.35mA, 125Hz. (D) Guanosine group exposed at 0.35mA, 125Hz. (n = 20/group).

