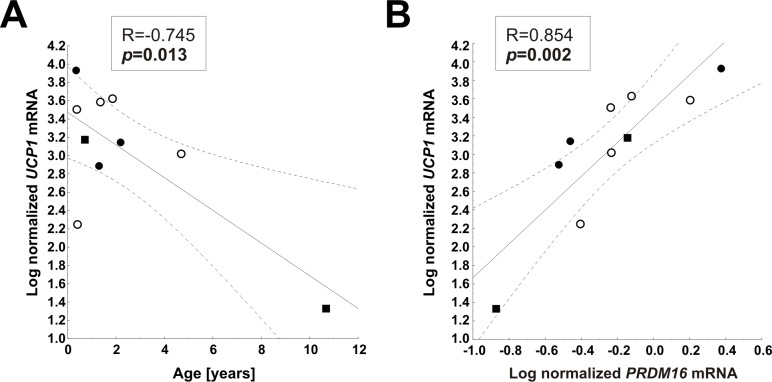
Fig 4. Correlation analysis in UCP1histological+ samples.
In statistical analyses which were restricted UCP1histological+ samples, we observed a negative association between UCP1 mRNA and age (A) and a positive association between UCP1 mRNA and PRDM16 (B). Pearson correlation coefficient R and p-value are shown in each scatterplot. Significant p-values (p<0.05) are indicated in bold. Black circles, subcutaneous depots; white circles, perirenal depots; and black squares, visceral depots.

