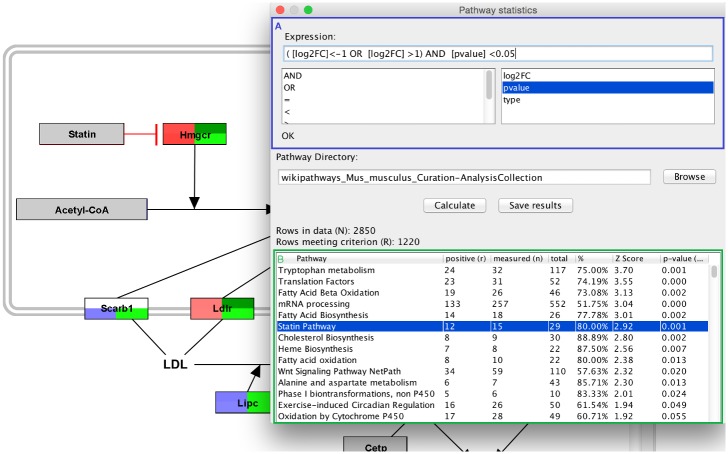
Fig 5. Pathway statistics result in PathVisio.
The user defines the criterion for significantly changed genes with an absolute log2FC > 1 (A). A Z-Score is calculated for each pathway in the pathway collection and in the result table the pathways are ranked based on their Z-Score (B). A high Z-Score indicates that the pathway is more affected than expected based on the overall dataset. The user can click on each pathway to open the pathway with the data visualized on it.

