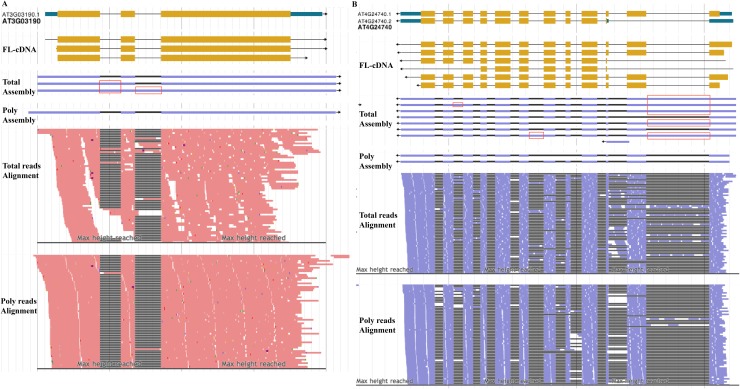
Fig 3. Alternative splicing of ATGSTF11 (A) and AFC2 (B) genes.
TAIR10 gene models, Full-length cDNA (FL-cDNA), transcripts assembled and reads alignments in the total RNA-seq and polyribosomal RNA-seq datasets are listed from top to bottom. Retained introns in total RNA-seq are highlighted using red rectangles. The red and blue colors represent forward and reverse reads in the read-alignment part, respectively.

