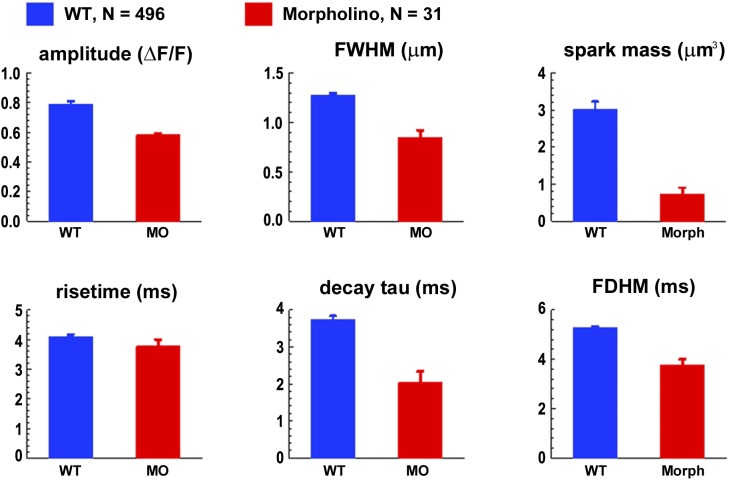
Figure 6.
Properties (mean ± SEM) of the individually analyzed sparks with peak amplitude >0.5 ΔF/F, detected in WT (blue) and morphant (red) myocytes. Spark mass (Hollingworth et al., 2001), an estimate of the volume integral of ΔF/F at the time of spark peak, is related to the amount of calcium released. The numbers of sparks analyzed individually (496 and 31) are larger than the numbers of sparks averaged for the images in Fig. 5 (376 and 26) because sparks were included in the averaged images only if the full time and space ranges were recorded and were free of other spark activity. All properties except for rise time are significantly different between WT and MO at P < 0.01.

