Figure 9.
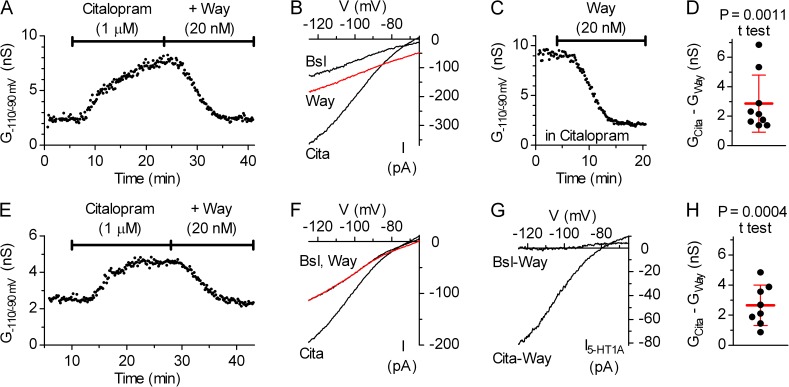
Extracellular Ca2+ is not required for autoinhibition. (A–D) Experiments in Ca2+-free extracellular solution. (A) Time course of a representative experiment (n = 6) illustrating the effect of 1 µM citalopram and its antagonism after the addition of 20 nM Way-100635 (+Way) in Ca2+-free extracellular solution, containing the cocktail of synaptic blockers: 5.5 mM [K+]o, 0.5 µM TTX, 10 µM Tbz, and 10 µM Trp. (B) The current–voltage plot of the same experiment. Traces are averages of the last nine individual ramps recorded before citalopram application (Bsl), in citalopram (Cita), and after the addition of Way-100635 (Way; red trace). Downward shift of the trace in Way in respect to the Bsl was caused by the gradual increase in leak, typical for recordings in Ca2+-free extracellular solution. (C) Time course of a representative experiment (n = 3) in which 1 µM citalopram was applied 30 min before obtaining whole-cell recording configuration, permitting the completion of the experiment under leak-free conditions. (D) Scatter plot summarizing the magnitude of 5-HT1A autoreceptor-mediated activation of GIRK conductance by 1 µM citalopram in Ca2+-free extracellular solution. Error bars correspond to mean ± SD. The addition of Way-100635 in the continuous presence of citalopram decreased inwardly rectifying K+ conductance by 2.86 ± 1.93 nS (mean ± SD; n = 9; P = 0.0011; one-tailed paired t test; normal distribution; P = 0.07; D’Agostino and Pearson omnibus test). (E–H) Experiments in the presence of the nonselective VGCC blocker Cd2+. (E) Time course of a representative experiment in extracellular solution containing the cocktail of synaptic blockers: 5.5 mM [K+]o, 0.5 µM TTX, 10 µM Tbz, 10 µM Trp, and 100 µM CdCl2. (F) The current–voltage plot of the same experiment. Traces are averages of 13 individual ramps recorded under the indicated conditions. (G) Current–voltage plot of net 5-HT1A autoreceptor-activated GIRK current (I5-HT1A) of the same experiment. The trace in Way-100635 is shown in red. (H) Scatter plot summarizing the magnitude of 5-HT1A autoreceptor-mediated activation of GIRK conductance by 1 µM citalopram in Cd2+-containing extracellular solution. Bars correspond to mean ± SD. The addition of 20 µM Way-100635 decreased inwardly rectifying K+ conductance by 2.66 ± 1.35 nS (mean ± SD; n = 8; P = 0.0004; one-tailed paired t test; normal distribution; P = 0.77; D’Agostino and Pearson omnibus test).

