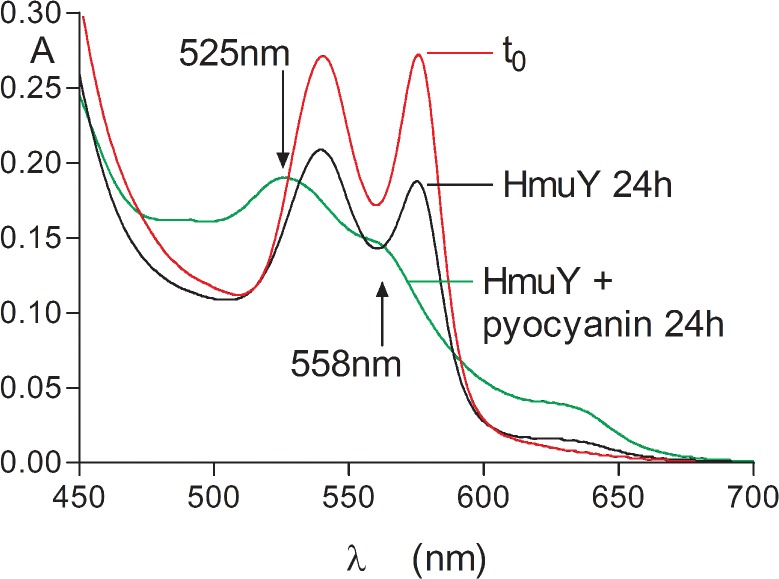
Fig 2. Formation of the HmuY-ferrihaem complex during co-incubation of oxyhaemoglobin with the P. gingivalis HmuY haemophore in the presence of pyocyanin.
HmuY and pyocyanin concentrations were 32 and 50 μM, respectively, whilst that of oxyhaemoglobin was 4 μM (with respect to tetramer). Buffer was 0.14 M NaCl, 0.1 M Tris-HCl, pH 7.5. Arrows indicate the 525 nm Q band plus 558 nm shoulder related to the presence of the HmuY-ferrihaem complex, green line; oxyhaemoglobin at time zero, red line; oxyhaemoglobin plus HmuY, black line.

