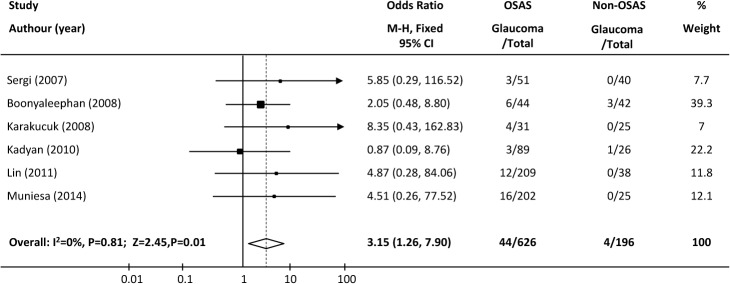
Fig 4. Forest plot of six cross-sectional studies with small sample sizes showing the odds ratios (ORs) with 95% confidence intervals (95% CI) of glaucoma for participants with and without OSAS.

The squares and horizontal lines represent the study-specific ORs and 95% CIs. The sizes of the squares reflect the statistical weights of the studies. The pooled OR is indicated by a diamond (fixed-effect model).
